GitHub Actions Self-Hosted Runner Observability and Monitoring
Table of Contents
- Background
- Our Stack
- GitHub Actions Exporter
- Making Metrics Useful with GHA Supervisor
- Alerting on Builds that could use Smaller Runners
- Monitoring the GitHub Actions Queue
- Synthetic Tests
Background
I led the migration from Jenkins to GitHub Actions (GHA) at Venmo. We were required to run CI/CD pipelines on our infrastructure. One pain point I had with GitHub Actions self-hosted runners was the complete lack of ability to monitor anything related to GHA on the runners.
This GitHub issue describes my pain:
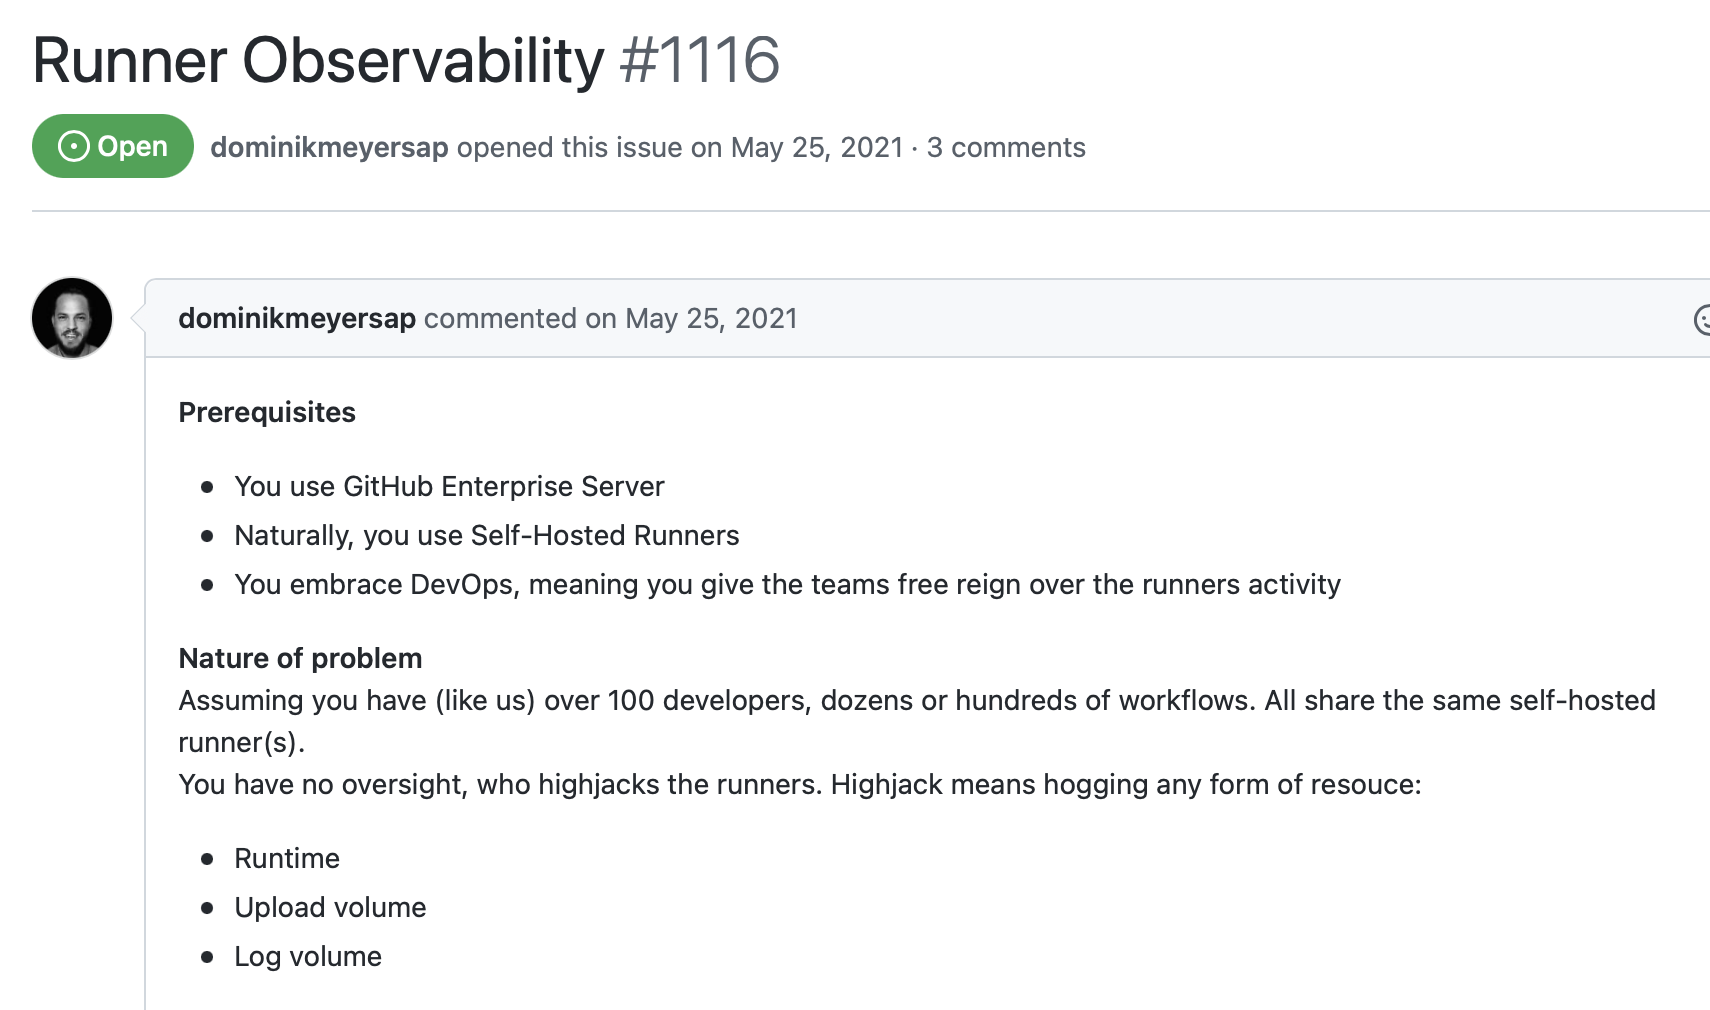
We wanted teams to be more self-sufficient. The old support model wasn’t scaling as the engineering organization grew. Other engineering teams needed our help to create and maintain CI/CD pipelines.
During the adoption of GitHub Actions, we gave engineers free rein to do more or less whatever they wanted on our fleet of self-hosted runners. Of course, terms and conditions may apply – just like your unlimited home internet connection.
Our Stack
Similar to the author of the GitHub issue above, we used GitHub Enterprise Server. We had to host our runners if we wanted to use GitHub Actions.
Our runners were hosted on managed Kubernetes via EKS with the Actions Runner Controller (ARC).
Finally, we used Datadog for our metrics and logging needs.
GitHub Actions Exporter

I used github-actions-exporter to capture some basic metrics, like workflow durations and the number of online runners connected to GitHub Enterprise.
The exporter is an imperfect solution that calls GitHub API on a loop to capture runner and workflow metrics.
Due to the way the GitHub API is laid out, you have to explicitly specify a list of repositories for github-actions-exporter to capture workflow metrics for which is not a great experience. It also means that for every repository you choose to monitor, it makes an additional API call per interval, therefore using up your API quota even faster.
I ran into an issue with github-actions-exporter that ended with me forking the repo. By default, it includes metrics with very high cardinality, such as node_id. We had a fleet of ephemeral self-hosted runners with high turnover, so the Prometheus /metrics endpoint quickly became too large to parse. Our fork rips out many of these fields that we didn’t use for stability.
Making Metrics Useful with GHA Supervisor
The GitHub Actions runner itself doesn’t expose any useful metrics. I installed a datadog agent on the runners to capture the basic metrics, such as CPU, memory, and network utilization.
GitHub doesn’t provide us with an out-of-the-box way to tie information about CI workflows into these metrics. For example, we wanted to measure how many resources specific workflows utilized and tie them into their repository.
I wrote a small, hacky script called GHA Supervisor to solve this problem.
The GHA supervisor would watch the GitHub actions runner log directories for new logs – meaning the runner was assigned a workflow to execute.
It then parses the logs to find the repository’s name and the workflow file’s name. Once we have the information we wanted to tag our datadog metrics, it calls to the kubernetes API to label the pod with the tags. The datadog agent is configured to add these tags to metrics and takes it from here.
Hacky and brittle? Yes, but GitHub didn’t give us any other option.
The result was once a workflow starts on a runner, metrics sent with datadog would tagged with our custom fields.
Alerting on Builds that could use Smaller Runners
We wanted to empower teams to use the CI platform without needing too much guidance. Little guidance meant engineers would often use more compute resources than they needed.
Once the GHA Supervisor was tagging metrics with the associated workflows, I created alerts.
I implemented a datadog monitor that alerted a slack channel when the workflow could fit on a smaller runner. For example, we would receive an alert if somebody was using a 4 CPU, 16 GB runner, and they didn’t use more than 2 CPU, 8 GB.
These alerts let us be proactive in reaching out to teams to save costs.
Monitoring the GitHub Actions Queue
Jenkins has a global job queue that you can see and monitor. The global job queue was immensely useful for operators. We knew if the job queue was backing up and how long it takes for a queued job to begin processing.
None of this is available for GitHub Actions out-of-the-box.
There’s a workflow_job webhook event that can be used to track queued, in_progress, and completed jobs.
I couldn’t use this event during my time at Venmo because our GitHub Enterprise version was behind, but this is how I would approach it today.
Synthetic Tests
We also implemented synthetic testing to get more observability into our CI/CD system for our customers.
The goal of our synthetic testing was to be quickly notified of what CI/CD features were down for users, such as artifact storage or deployments. Synthetics give us a way of making this determination instead of monitoring the failure rate of our users’ pipelines.
The problem with monitoring a global pipeline failure rate is that you can’t tell if spikes in failures are due to issues in the CI system or code-related. We couldn’t answer questions such as “are Artifactory issues causing builds to fail?”
The synthetics were implemented as GitHub Actions workflows that ran every minute using a cron workflow.
We had a synthetic test covering each use case that we wanted to ensure worked.
For instance, a workflow tested for successful pushes and pulls to/from Artifactory. Another workflow tested if we had connectivity to EKS.
The metrics from the synthetics let us put together an availability dashboard for our developers to know exactly what features were up or down at any given time.
Master GitHub Actions with a Senior Infrastructure Engineer
As a senior staff infrastructure engineer, I share exclusive, behind-the-scenes insights that you won't find anywhere else. Get the strategies and techniques I've used to save companies $500k in CI costs and transform teams with GitOps best practices—delivered straight to your inbox.
Not sure yet? Check out the archive.
Unsubscribe at any time.